- Print
- DarkLight
- PDF
Overview
Cerebrata is the only tool that allows users to view and manage the diagnostics data collected by their Classic Cloud Services running in Azure. It also provides a meaningful way of searching for diagnostics data, displaying them in an easy to understand way, and purging old data to keep cloud storage costs low. Below are the types of Logs that can be managed using Cerebrata:
- Trace Logs
- Event Logs
- Infrastructure Logs
- IIS Logs
- Failed request Logs
- Crash dumps
Trace Logs
Search
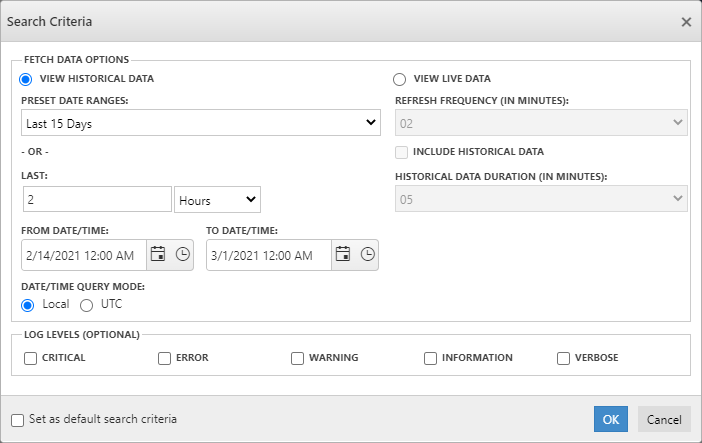
Using Cerebrata, user can search for Trace Logs collected by Cloud Services running in your Azure Subscription. It supports both "Historical" and "Live" search modes. Historical mode allows us to search for diagnostics data that has already been collected by selecting from the pre-defined date/time ranges (e.g. last 24 hours, current month etc.). It is also possible to define a custom date/time range as well. Live mode allows us to see the data as it is being stored in your storage account. It is also possible to choose the default search criteria whenever the user opens the log file.
Filter
Once the trace logs data is retrieved, the user can further filter it down by several criteria. You can filter data retrieved data based on event levels, deployment ids, role names and/or role instance names.
Download
Cerebrata also allows user to download Trace log data in CSV format for further analysis along with Searching and filtering.
Purge Data
Using Cerebrata, user can delete old log entries based on date/time range and/or event levels from the Azure storage account.
Following are the steps to purge old trace log data:
- Open Cloud Service Diagnostics node,
- Right-click on the Trace Logs and Select Purge Logs
- In the popup opened, Select the Data/Time range, Log Level and Verify code in Captcha
- Click Delete to purge logs in the selected criteria.
Event Logs
Search
Using Cerebrata, user can search for Event Logs collected by Cloud Services running in your Azure Subscription. It supports both "Historical" and "Live" search modes. Historical mode allows us to search for diagnostics data that has already been collected by selecting from the pre-defined date/time ranges (e.g. last 24 hours, current month etc.). It is also possible to define a custom date/time range as well. Live mode allows us to see the data as it is being stored in your storage account. It is also possible to choose the default search criteria whenever the user opens the log file.

Filter
Once the Event logs data is retrieved, the user can further filter it down by a number of criteria. You can filter data retrieved data based on event levels, event channels, provider names, deployment ids, role names and/or role instance names.
Download
Along with Searching and filtering, Cerebrata also allows user to download Event log data in CSV format for further analysis.
Purge Data
Using Cerebrata, user can delete old log entries based on date/time range and/or event levels from the Azure storage account.
Following are the steps to purge old Event log data:
- Open Cloud Service Diagnostics node
- Right-click on the Event Logs and Select Purge Logs
- In the popup opened, Select the Data/Time range, Log Level and Verify code in Captcha
- Click Delete to purge logs in the selected criteria.
Diagnostics Infrastructure Logs
Search
Using Cerebrata, user can search for Infrastructure Logs collected by Cloud Services running in your Azure Subscription. It supports both "Historical" and "Live" search modes. Historical mode allows us to search for diagnostics data that has already been collected by selecting from the pre-defined date/time ranges (e.g. last 24 hours, current month etc.). It is also possible to define a custom date/time range as well. Live mode allows us to see the data as it is being stored in your storage account. It is also possible to choose the default search criteria whenever the user opens the log file.

Filter
Once the Infrastructure logs data is retrieved, the user can further filter it down by a number of criteria. You can filter data retrieved data based on event levels, deployment ids, role names and/or role instance names.
Download
Along with Searching and filtering, Cerebrata also allows user to download Infrastructure log data in CSV format for further analysis.
Purge Data
Using Cerebrata, user can delete old log entries based on date/time range and/or event levels from the Azure storage account.
Following are the steps to purge old Infrastructure log data:
- Open Cloud Service Diagnostics node,
- Right-click on the Infrastructure Logs and Select Purge Logs
- In the popup opened, Select the Data/Time range, Log Level and Verify code in Captcha
- Click Delete to purge logs in the selected criteria.
IIS Logs
Search
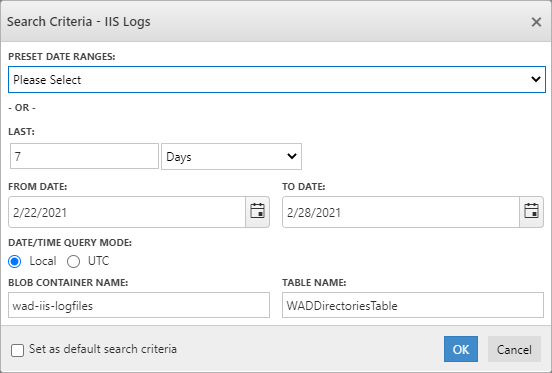
Using Cerebrata, the user can search for IIS Logs collected by Cloud Services running in the Azure Subscription. It provides an option to define search criteria based on Date/Time Range, Blob Container & Table Name. It is also possible to choose the default search criteria whenever the user opens the log file.
Filter
Once the IIS logs data is retrieved, you can further filter it down by several criteria. You can filter data retrieved data based on deployment ids, role names and/or role instance names.
Download
Along with Searching and filtering, Cerebrata also allows user to download IIS log data for further analysis.
View Data
Using Cerebrata, the user can even open a log file and view it.
Following are the steps to view a log file:
- Open the Log file; select the log to be opened
- Click Open (View) Log to open/ view the log details
- User can even double click on the log to open/view it
Failed IIS request Logs
Search
Using Cerebrata, user can search for Failed IIS Request Logs collected by Cloud Services running in the Azure Subscription. It provides an option to define search criteria based on Date/Time Range, Blob Container & Table Name. It is also possible to choose the default search criteria whenever the user opens the log file.

Filter
Once the IIS failed requests logs data is retrieved, you can further filter it down by several criteria. You can filter data retrieved data based on deployment ids, role names and/or role instance names.
Download
Along with Searching and filtering, Cerebrata also allows user to download IIS failed requests log data for further analysis.
Using Cerebrata, the user can even open a log file and view it.
Following are the steps to view a log file:
- Open the Log file; select the log to be opened
- Click Open (View) Log to open/ view the log details
- User can even double click on the log to open/view it
Crash dumps
Search
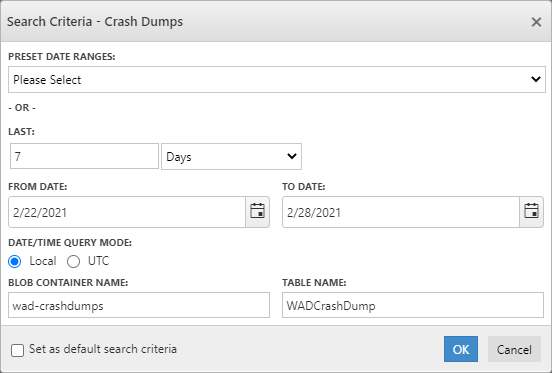
Using Cerebrata, user can search for Crash Dumps collected by Cloud Services running in the Azure Subscription. It provides an option to define search criteria based on Date/Time Range, Blob Container & Table Name. It is also possible to choose the default search criteria whenever the user opens the log file.
Filter
Once the crash dumps data is retrieved, you can further filter it down by a number of criteria. You can filter data retrieved data based on deployment ids, role names and/or role instance names.
Download
Along with Searching and filtering, Cerebrata also allows user to download crash dump data for further analysis.
Using Cerebrata, the user can even open a log file and view it.
Following are the steps to view a log file:
- Open the Log file; select the log to be opened
- Click Open (View) Log to open/ view the log details
- User can even double click on the log to open/view it
Settings
The user can enhance the management part of Cloud Service Diagnostics in Azure Storage Account with Cerebrata's settings. To leverage these settings,
Navigate to Files > Settings > Application Settings > Storage Settings> Cloud Service Diagnostics
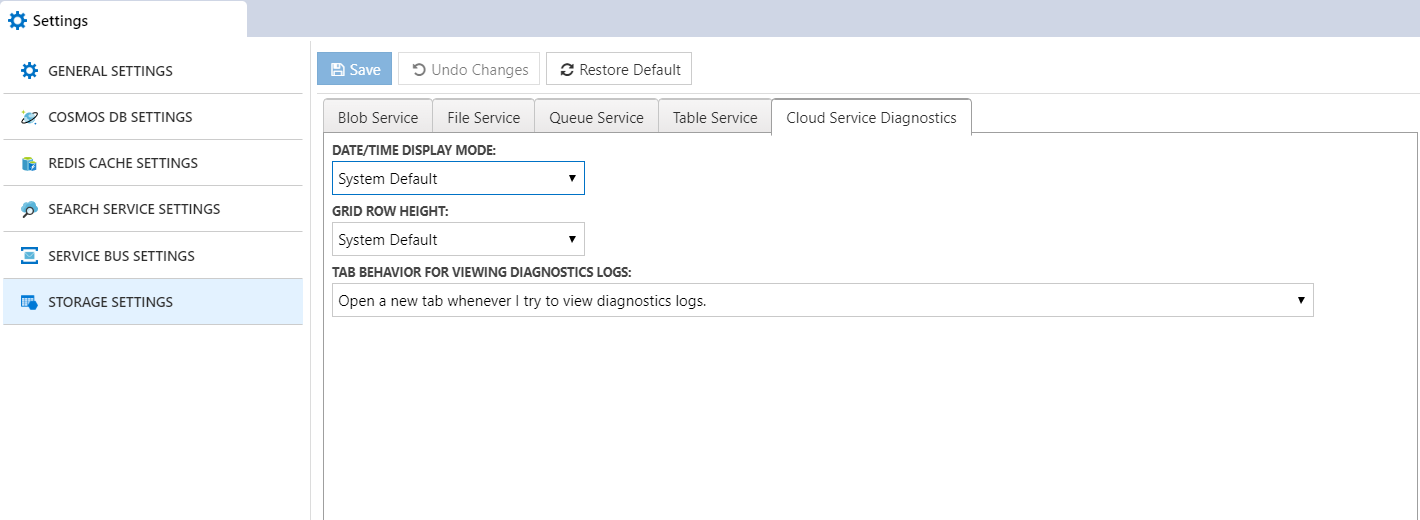
There is a capability to view date/time in local or UTC.
User can adjust or fix the grid row height of tables.
Set Tab Behaviour for viewing the Diagnostics Logs
